The Reserve Bank of Australia’s (RBA) quick increase in interest rates in an attempt to manage inflation has raised fears that Australia could fall into a recession within the next year or two. What effect would a recession have on Australian businesses, households, and asset markets if this occurred? What previous recessions has Australia experienced, and why did those recessions occur? This article will look to provide answers to these questions, as well as some indication, based on current statistics, of whether a recession is imminent.
What is a recession?
A recession is when economic output falls over an extended time period and the unemployment rate rises significantly. The most common definition is two quarters of negative growth in real Growth Domestic Product (GDP); the main measure of economic output. In most cases (though not always) recessions occur at the trough of the business cycle.
To understand why recessions occur, we must first understand the four major business cycle phases: expansion (typically the longest period), peak, contraction, and trough. The business cycle revolves around the economy’s potential growth line, which is the amount of output growth that the economy can accomplish while fully utilising its capital and human resources without putting upward pressure on prices. Population growth plus productivity is one rule of thumb for assessing the economy’s potential growth rate.
In the expansion phase demand for goods and services are rising, businesses are using more resources to meet growing demand, and employment, wages and prices are rising. The expansion phase ends in the peak phase, with output and prices running above what is sustainable long term. The peak phase turns to contraction when household and business demand weakens, businesses start reducing their workforce and wage and price growth slows. . Trough is the final phase, which occurs as a result of contraction. This phase can lead to recession depending on the intensity of the downturn.
Policymakers invariably want to avoid recession if they can. The loss of business activity and the rise in unemployment in a recession can have lasting, damaging effects on the potential of the economy to grow, not to mention the broader financial system and social cohesion. However, policymakers need to know when recession is occurring to be able to do anything about it. Relying on GDP data to determine when the economy is in recession provides a warning well after recession has started. By looking at the characteristics of the contraction and trough phases of the business cycle, it is possible to build a definition of recession beyond back-to-back quarters of negative GDP growth.
GDP data encompasses the whole economy, including all of its various spending, income, and production functions. Because the substantial information contained in GDP data takes time to collect and publish, GDP data in Australia is issued more than two months after the quarter to which it corresponds. The next GDP report for Q2 2023 will be released in early September, two-thirds of the way through Q3 2023. If Australia has back-to-back negative quarterly GDP growth in Q2 and Q3 2023, the first indication of a recession based on back-to-back negative GDP would be in early September and would require confirmation with a negative Q3 GDP announcement not due until December.
Furthermore, in order to release GDP reports in a reasonable time frame, the Bureau of Statistics relies on a combination of hard data plus surveys and informed assumptions to fill in information that will not be accessible in hard form until many months after the GDP release. When additional firm information becomes available, quarterly GDP reports are always revised. A negative GDP growth quarter might be corrected to a positive quarter (or a positive quarter to a negative one) three, six, or even nine months after the original report was released.
The ‘two consecutive negative GDP growth quarters’ definition of recession is only really useful for looking at recessions that originated some time ago. When considering the possibility of a current or future recession, what happens during the contraction and trough business cycle phases can provide some hints. Signs of large contraction in household and business demand – falling monthly retail sales; stalling home sales and prices; evidence of financial stress; businesses investing less; unintended build-up in inventories; increasing business failures; and slowing employment growth and rising unemployment – will often show up in monthly data and surveys several months prior to the publication of quarterly GDP reports.
Recessions are always accompanied by significant increases in the unemployment rate, with some experts interpreting an increase in the unemployment rate of a percentage point or more from its low point in the cycle as a strong indicator that the economy has entered a recession. The unemployment rate change method of determining whether we are in a recession has advantages over waiting for GDP data because it is published sooner after the period to which it relates (within a fortnight of the month covered), and it is less subject to revision than GDP data.
The disadvantage of using the unemployment rate is that it is a lagging indicator of changing economic activity. Businesses take time to adjust down their employment needs after demand growth weakens. The unemployment rate rises several months after growth in the economy has started to slow and could take a year or more to rise to a level warning of recession.
While it is difficult to assess at present whether the economy is entering recession, or just suffering a period of weaker but still positive economic growth, it is clear cut when the Australian economy has suffered recession in the past using the two-quarters of negative GDP growth definition.
Past Australian recessions
Over the past 50 years Australia has suffered four clear periods of recession (Figure 1). There have been other isolated one quarter negative GDP readings over the same period that were recession-like; exhibiting slowing demand and rising unemployment, but these have been judged as periods of weak growth rather than recessions.
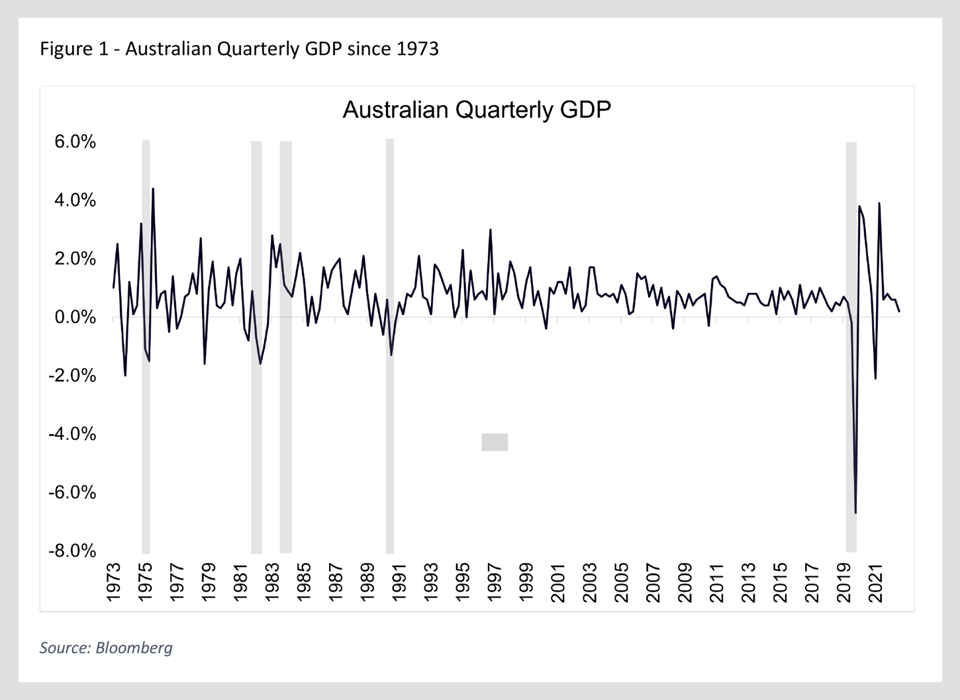
The first recession of the past 50 years was in 1975 (Q3 real GDP -1.1% q-o-q, Q4 -1.5% q-o-q), the second a double-dip recession between late 1981 and early 1983 (Q4’81 -0.4% q-o-q, Q1’82 -0.8% q-o-q, then brief recovery in Q2’82, +0.9% q-o-q ahead of four consecutive quarterly falls from Q3’82 to Q2’83 of -0.7%; -1.6%; -1.0%; and-0.2%), the third in 1991 (Q1 -1.3% q-o-q, Q2 -0.2% q-o-q) and then a 29-year economic expansion until the fourth recession in 2020 (Q1, -0.2% q-o-q, Q2 -6.7% q-o-q) which was brought about by the impact of the COVID-19 pandemic.
The 1975 recession occurred following the global oil price shock, which saw oil prices quadruple, causing several of Australia’s key export trading partners to enter recession while also driving up local business costs, prices, and wages. Foreign demand for Australian exports declined, which was exacerbated by a fixed Australian dollar exchange rate that had previously been established excessively high and had been revalued upwards by official dictate to help curtail high inflation, which eventually peaked at 18%. Due to declining demand and high costs, Australian businesses began to lay off workers. The unemployment rate, which had fallen below 3% at times in the late 1960s and early 1970s, rose to 5.5% during the recession and declined only modestly during the subsequent economic recovery.
After the 1975 recession, inflation was slow to subside, owing to persistently high oil prices, as well as excessive money supply growth and lax fiscal policy. Inflation had been too high for too long by the early 1980s, and central banks around the world were tightening policy settings. In Australia, the RBA’s policy tightening coincided with the onset of recession in several of the country’s key trading partners, as well as a prolonged and devastating drought that reduced agricultural output.
The double-dip recession that occurred between 1981 and 1983 saw the unemployment rise from 5.4% in July 1981 to a peak of 10.5% in July 1983. It would take twenty-one years before the unemployment rate would return as low as 5.4%. The early 1980s recession caused considerable hardship for Australian households and businesses and left a lasting physical reminder in Australia’s biggest cities, where many commercial building projects were abandoned, leaving a legacy of holes in the ground in city centres that would take years to resume.
The end of the drought in 1983, along with looser policy conditions aimed at assisting the economy’s recovery from recession, triggered a period of excessive demand in the mid-1980s, driving up asset prices and inflation. The October 1987 stock market fall temporarily dampened demand, but the policy steps implemented in response, such as cutting interest rates and increasing liquidity in the financial system, quickly sparked a return of excessive demand, housing market speculation, and rising inflation. To deal with excessive inflation, the RBA promptly and severely raised the cash rate to nearly 18.0% at one point, recognising that a recession – however undesirable – would be required to combat high inflation. Treasurer Keating famously spoke of this period as ‘the recession that Australia had to have’.
Many of Australia’s major trading partners were also using high interest rates to deal with high inflation and were entering recession as a result. In November and December 1989 Australia’s unemployment rate was at its low point of 5.8%. It would peak at 11.2% three years later in December 1992 (some 18 months after the back-to-back negative quarterly GDP readings in 1991). The unemployment rate sat above 10% for 32 months in the early 1990s and youth unemployment was especially high, creating social unrest. Financial institutions suffered a sharp rise in non-performing loans.
The early 1990s recession broke the back of high inflation and ushered in a long period of disinflation and falling interest rates. There were periods through the 1990s and 2000s where excessive demand and briefly higher inflation would push the RBA to hike official interest rates, but peak interest rates were always below the previous peak.
The next threat of recession came not from an RBA policy tightening cycle, but the global financial crisis in 2008 and 2009. In many countries, including the United States, the severe stresses in the banking and financial system prompted a loss of economic output and rising unemployment. Many countries experienced recession. Australia suffered growth slowdown and some lift in unemployment (peaking at 6%) but trade links to the strong Chinese economy, a sound banking system by international comparison, and a sharp increase in government spending combined with easier monetary conditions worked to avoid recession.
Australia’s most recent recession in 2020 occurred because of the abrupt reduction in economic output caused by restrictions put in place to help contain the COVID-19 pandemic. Rapid development and rollout of vaccines prompted the winding back of restrictions through 2021 and 2022, one factor helping to promote a sharp recovery. During the short but deep recession, the unemployment rate briefly lifted above 7%. However, the Government and the RBA were fearful that the recession would be deeper and longer than occurred with potential for the unemployment rate to lift above 10%. The Government boosted spending by the equivalent of 15% of GDP, mostly in income support payments for households and businesses, while the RBA reduced the cash rate to 0.10% and at one stage capped the 3-year bond yield at 0.10%. Historically large fiscal and monetary stimulus reduced the depth of the recession, catapulted the economy to strong growth (+3.8% q-o-q in Q3 2020 and +3.4% q-o-q in Q4) and saw the unemployment rate fall rapidly below 4%, mirroring lows last experienced half a century before.
The demand recovery has proven to be too strong, stretching supply of goods and services, hampered by various events such as COVID and the Ukraine War, and causing significant inflation in Australia, peaking at 7.8% year on year in Q4 2022. Since May 2022, the RBA has been raising its cash rate in order to control inflation, and those higher borrowing interest rates are raising the question of whether Australia will soon experience another recession.
Recession ahead?
Under pressure from rising interest rates, Australian GDP growth has moderated to only 0.2% q-o-q in Q1 2023. It is possible that Australia could experience back-to-back negative GDP growth quarters later in 2023 or in 2024, but there are factors at play that still mitigate against a recession.
The first factor is the return of strong immigration, resulting in population growth lifting to near 2% y-o-y over the next year or two. Population growth is keeping housing demand strong and working to counter the housing-demand-reducing impact of higher interest rates. Home buying activity and prices have invariably been weak in earlier Australian recessions (during the 2020 recession house prices fell the most in 40 years), but home buying and prices are currently rising.
A second factor is the current strength of the labour market combined with rising wages. Labour income is lifting at near double-digit growth pace at present. The strength of labour income is a problem for the RBA trying to contain inflation, but it is providing support for spending even as household budgets are strained by the high cost-of-living and mortgage payments.
A final factor is that the Australian share market is showing few signs of being concerned by a potential sharp reduction in earnings that would accompany a recession. Some of the worst annual return falls from the share market in the past have occurred heading into recession (Figure 2). Also, some of the best returns occur coming out of recession.
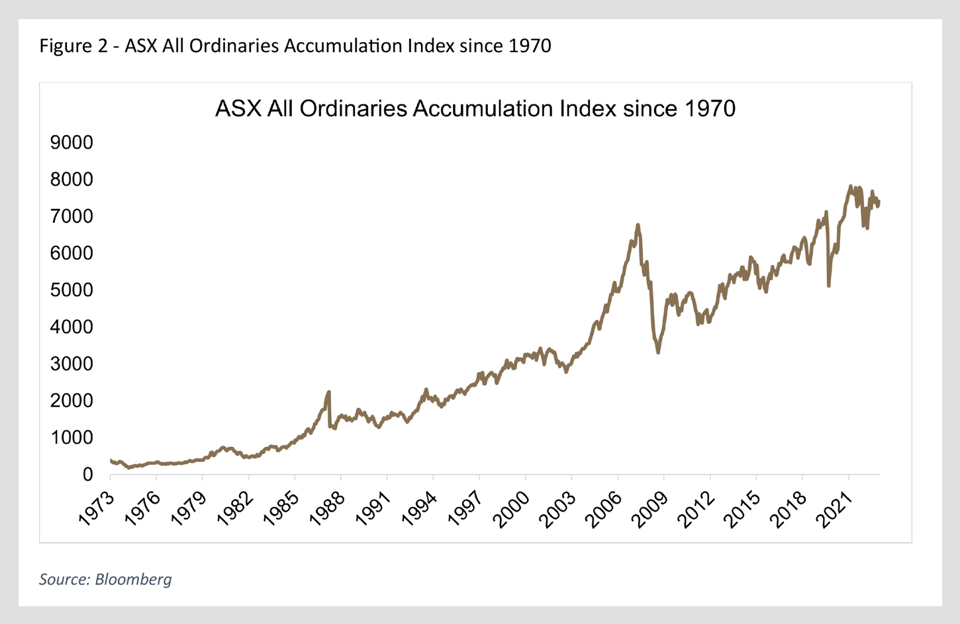
Going back to the 1975 recession, the Australian All Ordinaries Accumulation index fell 23.3% in 1973 and fell another 26.9% in 1974 before lifting 62.9% in 1975. The doble-dip recession in the early 1980s saw the index fall 12.9% in 1981 and another 13.9% in 1982 before lifting 66.8% in 1983. The first-half 1991 recession saw the index down by 17.5% in 1990 before lifting 34.2% in 1991. The global financial crisis non-recession for Australia saw the index down 40.4% in 2008 followed by a 39.6% rise in 2009. Breaking the pattern, the COVID recession in 2020 and quick rebound saw the share market rise only 3.6% in 2020 before pushing up 17.7% in 2021.
Now, in mid-2023 the share market has been pushing higher so far this year and is up over 10% over the past year. Barring a sudden and large fall, investors in the Australian share market are saying no recession immediately ahead.
Conclusion
Except for a technical recession caused by the pandemic in 2020, Australia has not had a true recession in over 30 years. These periods of negative GDP typically have far-reaching and terrible consequences for ordinary Australians, so it is understandable that the prospect of another one has economists, policymakers, and individuals on edge. However, it is critical to consider things holistically and not behave rashly based on what is frequently dramatised information and hyperbole. A recession is not always difficult to predict if you look in the proper places, and being able to make this assessment will be a vital tool for investors in ensuring they are as prepared as possible if one were to eventuate.